
The Hidden Cost of Manual Deployments (and How to Measure It)
Manual releases quietly drain time and reliability. Learn a practical framework to quantify deployment friction and prioritize automation that improves delivery.
Manual deployments don’t explode—they erode

Manual deployment processes rarely fail in a headline-making way. Instead, they create a steady tax on your team’s attention: extra approvals, copy-pasted commands, “just to be safe” checklists, and late-night coordination. In devops, that friction compounds because releases are frequent, systems are distributed, and the cost of context-switching is high. The result is slower delivery, more variance between “good” and “bad” deploys, and a gradual decline in confidence.
The hidden cost is that your best engineers spend time acting as human glue rather than building product. Over time, manual steps become institutional knowledge—hard to transfer, harder to audit—and teams accept longer lead times as normal. This is exactly where engineering-metrics and DORA metrics help: they turn vague pain into measurable signals.
If you want to justify automation, start by treating each manual release as a small incident: it consumes toil, increases risk, and introduces unpredictable waiting. Measuring that “deployment friction” is the first step to eliminating it.
A practical framework to quantify deployment friction
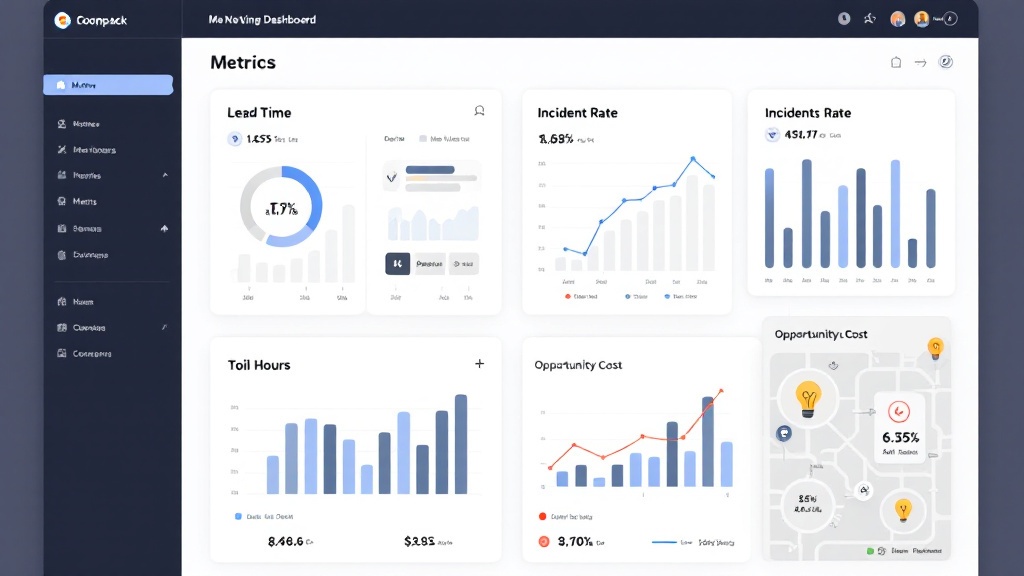
To measure the hidden cost, build a simple baseline across four dimensions: lead time, toil hours, incident rate, and opportunity cost. Lead time maps to DORA metrics (commit-to-production) and exposes waiting: approvals, handoffs, and “release windows.” Toil hours capture how much human effort a deployment requires—prepping releases, running scripts, watching dashboards, and coordinating on Slack. Incident rate includes rollbacks, hotfixes, and “minor” post-deploy interruptions that still steal focus.
Opportunity cost is the multiplier: what didn’t get built because releases required constant babysitting? A practical method is to estimate: (deploys per week) × (average human hours per deploy) × (loaded hourly cost), then add an interruption factor for incidents (e.g., average engineer-hours per incident). Even rough numbers are powerful because they convert frustration into a budget.
You can pull most inputs from data you already have: Git timestamps, ticketing systems, chat logs, and on-call notes. This is engineering-metrics applied to deployment reality—simple enough to start, credible enough to act on.
Use the numbers to prioritize automation that moves the needle
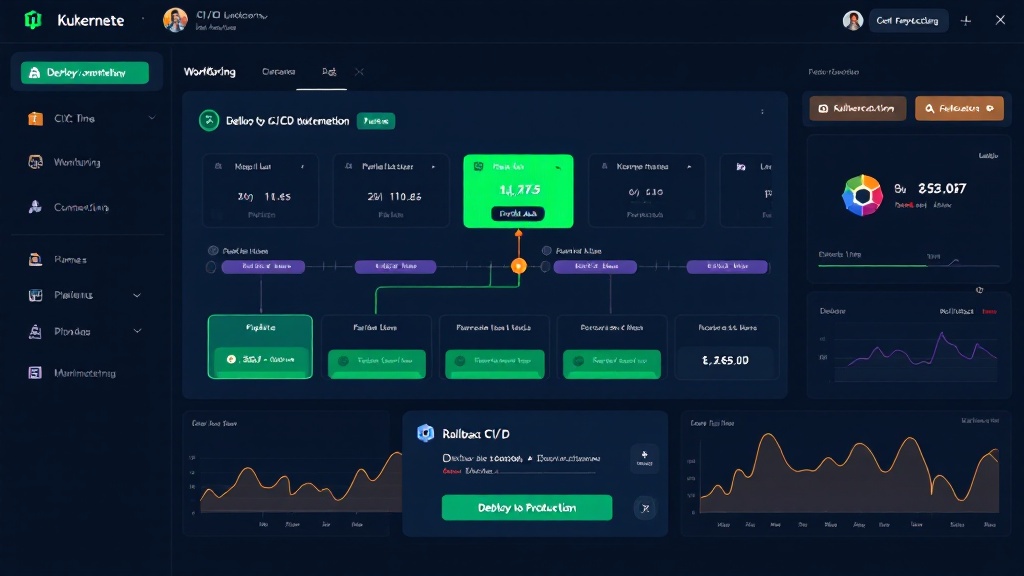
Once you have a baseline, use it to pick automation work with measurable impact. Look for steps that are both frequent and high-variance: manual environment setup, test runs that aren’t parallelized, hand-entered configuration, and deploy-time checks that rely on tribal knowledge. If lead time spikes around approvals, streamline with policy-based gates; if toil hours are high, eliminate repetitive tasks with standardized pipelines; if incidents cluster around release days, invest in safer rollout patterns and faster rollback.
A useful rule: prioritize any change that reduces the “human minutes per deploy” and the “minutes to detect/restore” after a bad release. These map directly to DORA metrics (lead time and change failure rate) and are easy to re-measure after each improvement. Track progress weekly, not quarterly, so teams see momentum.
Platforms like PipelineVelocity make this practical by orchestrating builds, parallel tests, and Kubernetes deployments with visual pipeline management, real-time monitoring, and one-click rollback controls. When your devops pipeline is observable and repeatable, every release becomes boring—in the best way.